How Data Has Transformed Modern-Day Visual Merchandising
How Data Has Transformed Modern-Day Visual Merchandising
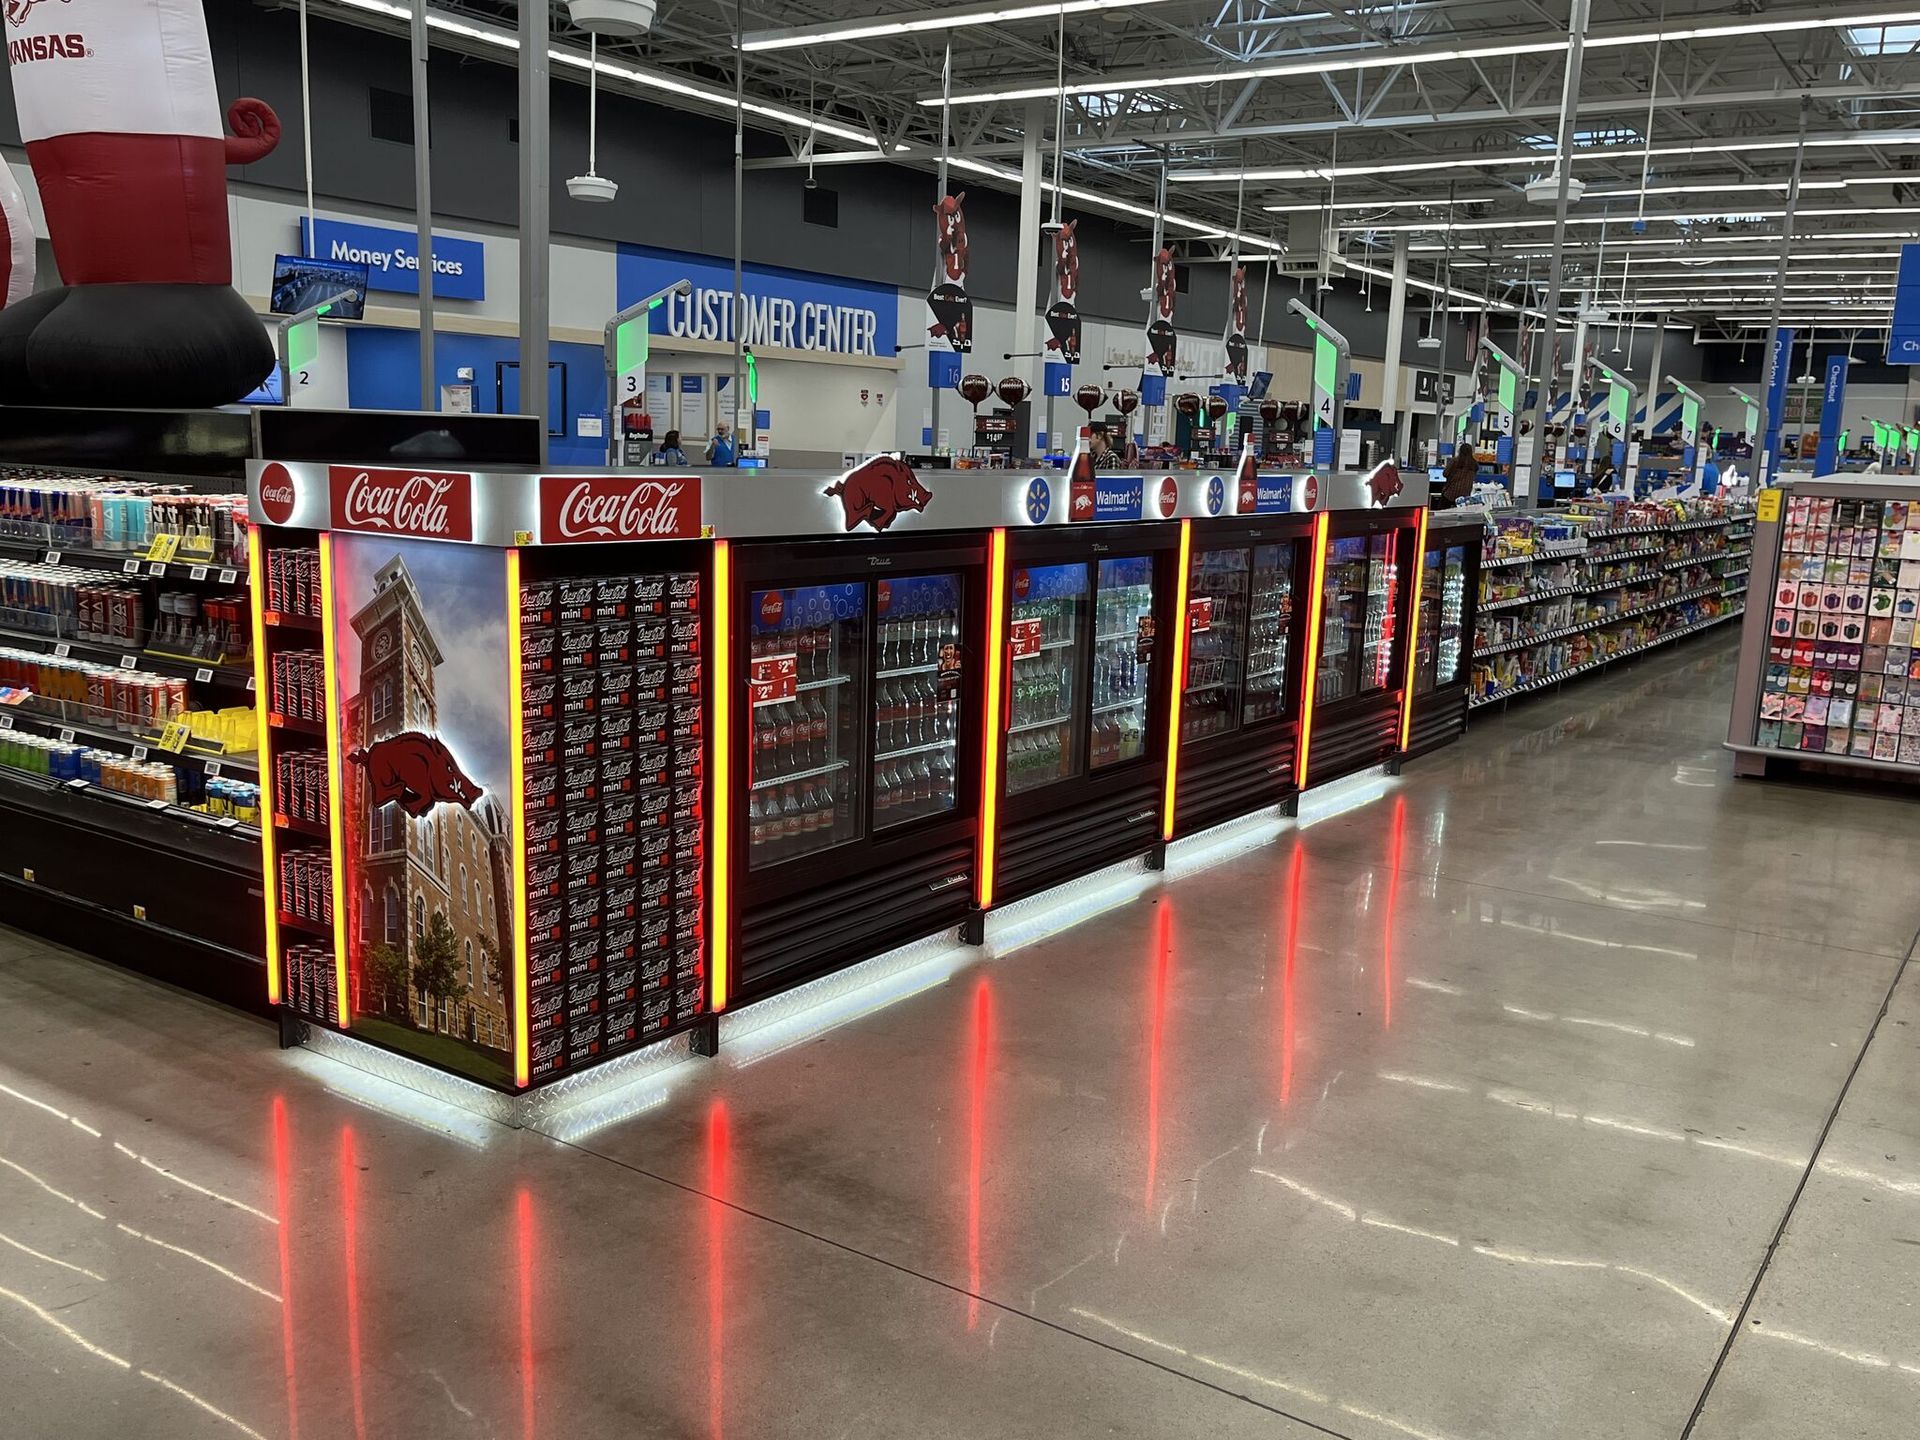
How Data Has Transformed Modern-Day Visual Merchandising. It’s a little surprising to consider how new visual merchandising really is, but in terms of retail design as a movement in American shopping, we really have only begun to scratch the surface. For years, most consumers did their shopping in large specialty stores, department stores, or local mom-and-pop general stores, but in the 1960s and 1970s the idea of the boutique store came into existence, setting the stage for what would evolve over the course of the next two decades into what we now recognize as retail merchandising strategies that have real positive effects on sales.
In current times, though, we still are seeing change in the way visual merchandising works, due in large part to the data that businesses are generating in regard to the way that their customers shop. Here at Presence from Innovation, we help businesses sift through this data to determine the best ways to approach visual merchandising in the modern world. In terms of what has changed from the 1970s, consider the following data-driven approaches to visual merchandising:
Tracking Movement
Many businesses track the movement of people in their stores to get a sense of what directions they naturally head in so that they can organize goods around those routes. Data allows these business to plan their store layout incredibly carefully, making sure to focus on where items are located when compared to the direction that customers travel while inside the store. Visual merchandising strategies absolutely can help maximize profit using data to track these types of things.
Sales Per Area
One of the best metrics for gauging the performance of a brick-and-mortar store is sales per area, which lets business owners know how efficient they are being with the use of their space. Sales per area is determined by how much money in sales is brought in over the course of a year compared to the size of the store, and visual merchandising allows these business owners to earn more money in smaller spaces by making better use of that space and arranging profitable items in ideal locations. Retail analytics software absolutely can help with this.
Baskets and Basket Sizes
Data also can track what sorts of items people are buying at the same time. It can be nice to get a sense of whether people who buy one thing also are buying another thing, as that could affect how a store gets laid out. Basket sizes help in terms of tracking how many items people are purchasing, and knowing that data is a key aspect of improving sales.
Applying All of This to the Internet
Of course, the biggest change from the 1970s to now is that visual merchandising must also be applied to vendors who sell via the internet. While there are an entirely different set of rules for selling things online, the same basic principles exist about using data to improve the look and functionality of a website in an attempt to boost sales.
Here at PFI, we want to help businesses use data to improve their own visual merchandising. As this data continues to prove, knowing how and why things sell is every bit as important as determine what to sell and where to sell it.